ambari二次开发分享(三) 目录
添加quicklinks quicklinks也就是ambari组件右侧的跳转链接,对应的是组件的web ui
1 2 3 4 5 6 7 <quickLinksConfigurations > <quickLinksConfiguration > <fileName > quicklinks.json</fileName > <default > true</default > </quickLinksConfiguration > </quickLinksConfigurations >
quickjson.json文件的默认目录实在服务根目录的quicklinks目录下
quicklinks.json内容解析 先确定协议(HTTP 与 HTTPS),然后“links”部分用于显示,在 Ambari Web UI 上显示的每个快速链接的元信息。 JSON 文件的顶部有一个 “name” 属性,用于标识快速链接 JSON文件的名称。
1
2
3
4
5
6
7
8
9
10
11
12
13
14
15
16
17
18
19
20
21
22
23
24
25
26
27
28
29
30
31
32
{ "name" : "default" , "description" : "default quick links configuration" , "configuration" : { "protocol" : { "type" : "https" , "checks" : [ { "property" : "es.head.http.policy" , ---该属性的值为HTTP_ONLY或是HTTPS_ONLY "desired" : "HTTPS_ONLY" , "site" : "elastic-config" ---property属性所在的文件 } ] } , "links" : [ { "name" : "elasticsearch_ui" , "label" : "Elasticsearch-head UI" , "component_name" : "ELASTICSEARCH_HEAD" , "url" : "%@://%@:%@" , "port" : { "http_property" : "elasticsearch_head_port" , "http_default_port" : "9100" , "https_property" : "elasticsearch_head_port" , "https_default_port" : "9100" , "regex" : "^(\\d+)$" , "site" : "elastic-config" } } ] } }
为自定义服务添加监控指标并展示 这里应该在metainfo.xml里面配置好监控哪个组件,在需要监控的组件下添加
1 <timelineAppid > elasticsearch</timelineAppid >
比如下面的写法:
1 2 3 4 5 6 7 8 9 10 11 12 13 14 15 16 17 18 19 20 21 22 23 24 25 26 <component > <name > ELASTICSEARCH_SERVICE</name > <displayName > Elasticsearch Service</displayName > <category > MASTER</category > <cardinality > 1+</cardinality > <timelineAppid > elasticsearch</timelineAppid > <commandScript > <script > scripts/master.py</script > <scriptType > PYTHON</scriptType > <timeout > 1800</timeout > </commandScript > <customCommands > <customCommand > <name > test_master_check</name > <background > true</background > <commandScript > <script > scripts/master.py</script > <scriptType > PYTHON</scriptType > </commandScript > </customCommand > </customCommands > </component >
这里注意这里的timeLineAppid是唯一的,不区分大小写,写的都是服务的名称Metrics Collector会根据这个来区分各个服务的监控指标信息
添加自定义监控指标 步骤总结
通过 widgets.json 文件定义服务 widgets 。
通过 metrics.json 文件声明服务指标。
将服务指标推送到 Ambari Metrics Collector 中。
公共部分
1
2
3
4
5
6
7
8
9
10
11
12
{ "layouts" : [ { "layout_name" : "default_elasticsearch_dashboard" , "display_name" : "Standard Elasticsearch Dashboard" , "section_name" : "ELASTICSEARCH_SUMMARY" , "widgetLayoutInfo" : [ ] } ] }
注意
“layout_name”: “default_${服务名小写}_dashboard”
“section_name”: “${服务名大写}_SUMMARY”
这俩属性的值不能乱定义。
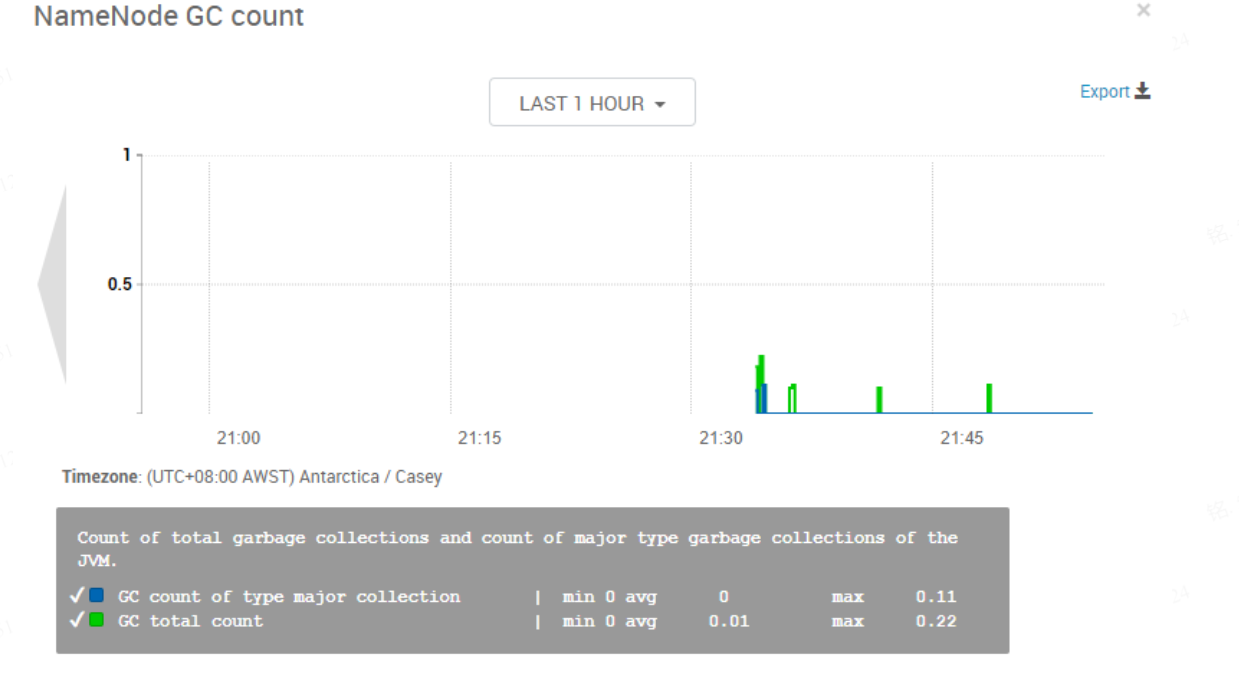
Graph类型
1
2
3
4
5
6
7
8
9
10
11
12
13
14
15
16
17
18
19
20
21
22
23
24
25
26
27
28
29
30
31
32
33
34
35
36
{ "widget_name" : "NameNode GC count" , "description" : "Count of total garbage collections and count of major type garbage collections of the JVM." , "widget_type" : "GRAPH" , "is_visible" : true , "metrics" : [ { "name" : "jvm.JvmMetrics.GcCount._rate" , "metric_path" : "metrics/jvm/gcCount._rate" , "service_name" : "HDFS" , "component_name" : "NAMENODE" , "host_component_criteria" : "host_components/metrics/dfs/FSNamesystem/HAState=active" } , { "name" : "jvm.JvmMetrics.GcCountConcurrentMarkSweep._rate" , "metric_path" : "metrics/jvm/GcCountConcurrentMarkSweep._rate" , "service_name" : "HDFS" , "component_name" : "NAMENODE" , "host_component_criteria" : "host_components/metrics/dfs/FSNamesystem/HAState=active" } ] , "values" : [ { "name" : "GC total count" , "value" : "${jvm.JvmMetrics.GcCount._rate}" } , { "name" : "GC count of type major collection" , "value" : "${jvm.JvmMetrics.GcCountConcurrentMarkSweep._rate}" } ] , "properties" : { "graph_type" : "LINE" , "time_range" : "1" } }
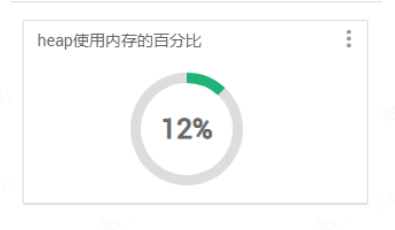
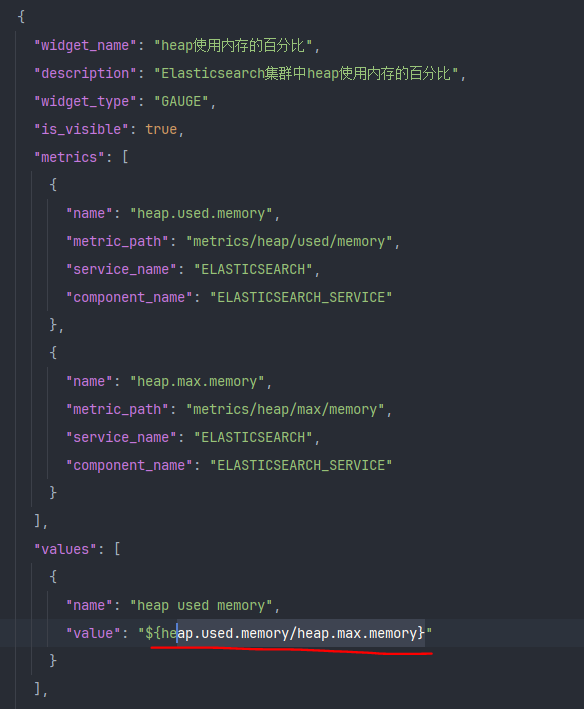
Gauge支持类型
1
2
3
4
5
6
7
8
9
10
11
12
13
14
15
16
17
18
19
20
21
22
23
24
25
26
27
28
29
30
{ "widget_name" : "heap使用内存的百分比" , "description" : "heap使用内存的百分比,当值达到75%的时候开始GC" , "widget_type" : "GAUGE" , "is_visible" : true , "metrics" : [ { "name" : "heap.used.memory" , "metric_path" : "metrics/heap/used/memory" , "service_name" : "ELASTICSEARCH" , "component_name" : "ELASTICSEARCH_SERVICE" } , { "name" : "heap.max.memory" , "metric_path" : "metrics/heap/max/memory" , "service_name" : "ELASTICSEARCH" , "component_name" : "ELASTICSEARCH_SERVICE" } ] , "values" : [ { "name" : "heap used memory" , "value" : "${heap.used.memory/heap.max.memory}" } ] , "properties" : { "error_threshold" : "0.9" , "warning_threshold" : "0.75" } }
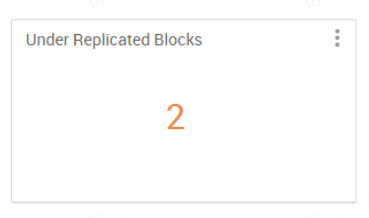
Number支持类型
1
2
3
4
5
6
7
8
9
10
11
12
13
14
15
16
17
18
19
20
21
22
23
24
25
26
{ "widget_name" : "Under Replicated Blocks" , "description" : "Number represents file blocks that does not meet the replication factor criteria. Its indicative of HDFS bad health." , "widget_type" : "NUMBER" , "is_visible" : true , "metrics" : [ { "name" : "Hadoop:service=NameNode,name=FSNamesystem.UnderReplicatedBlocks" , "metric_path" : "metrics/dfs/FSNamesystem/UnderReplicatedBlocks" , "service_name" : "HDFS" , "component_name" : "NAMENODE" , "host_component_criteria" : "host_components/metrics/dfs/FSNamesystem/HAState=active" } ] , "values" : [ { "name" : "Under Replicated Blocks" , "value" : "${Hadoop:service=NameNode,name=FSNamesystem.UnderReplicatedBlocks}" } ] , "properties" : { "warning_threshold" : "0" , "error_threshold" : "50" } }
Number 支持单位显示:常用的有 ms,min,d 等,用 display_unit 定义。
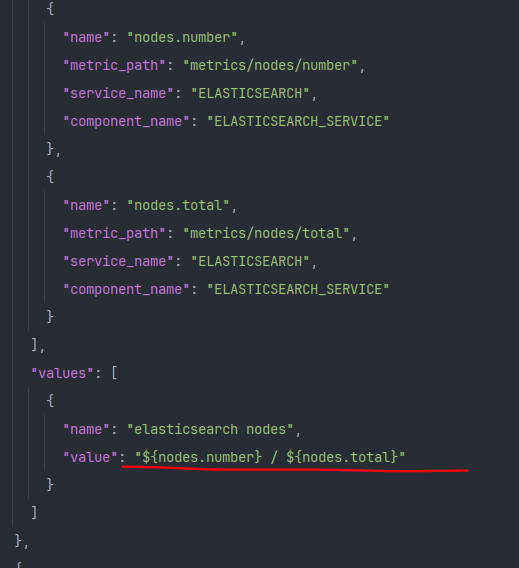
Template支持类型
1
2
3
4
5
6
7
8
9
10
11
12
13
14
15
16
17
18
19
20
21
22
23
24
25
26
27
{ "widget_name" : "Elasticsearch集群节点的存活占比" , "description" : "Elasticsearch集群节点的存活占比,存活个数/总个数" , "widget_type" : "TEMPLATE" , "is_visible" : true , "metrics" : [ { "name" : "nodes.number._max" , "metric_path" : "metrics/nodes/number._max" , "service_name" : "ELASTICSEARCH" , "component_name" : "ELASTICSEARCH_SERVICE" } , { "name" : "total.nodes.number._max" , "metric_path" : "metrics/total/nodes/number._max" , "service_name" : "ELASTICSEARCH" , "component_name" : "ELASTICSEARCH_SERVICE" } ] , "values" : [ { "name" : "the number of nodes" , "value" : "${nodes.number._max} / ${total.nodes.number._max}" } ] }
指标的聚合函数
max:所有主机组件的指标最大值
min:所有主机组件中指标的最小值
avg:所有主机组件的指标平均值
sum:所有每个主机组件的度量值总和
metrics.json 1 2 3 4 5 6 7 8 9 10 11 12 13 14 15 16 17 18 19 { "<服务组件名称>" : { "Component" : [ { "type" : "ganglia" , "metrics" : { "default" : { "<metricKey>" : { "metric" : "<metricName>" , "pointInTime" : true , "temporal" : true } , ... } } } ] } }
启动服务 最后当我们将上述的文件都改好后,还要将这个文件放到 /var/lib/ambari-server/resources/stacks/HDP/3.1/services/ELASTICSEARCH 目录下。然后重启 ambari-server,重新安装服务才行
向 Ambari Metrics Collector 发送指标数据 这里还没有数据,因为我们还没有写关于监控对应的数据,然后将监控的数据根据发送请求的方式来将监控的数据定期通过curl发送给Collector
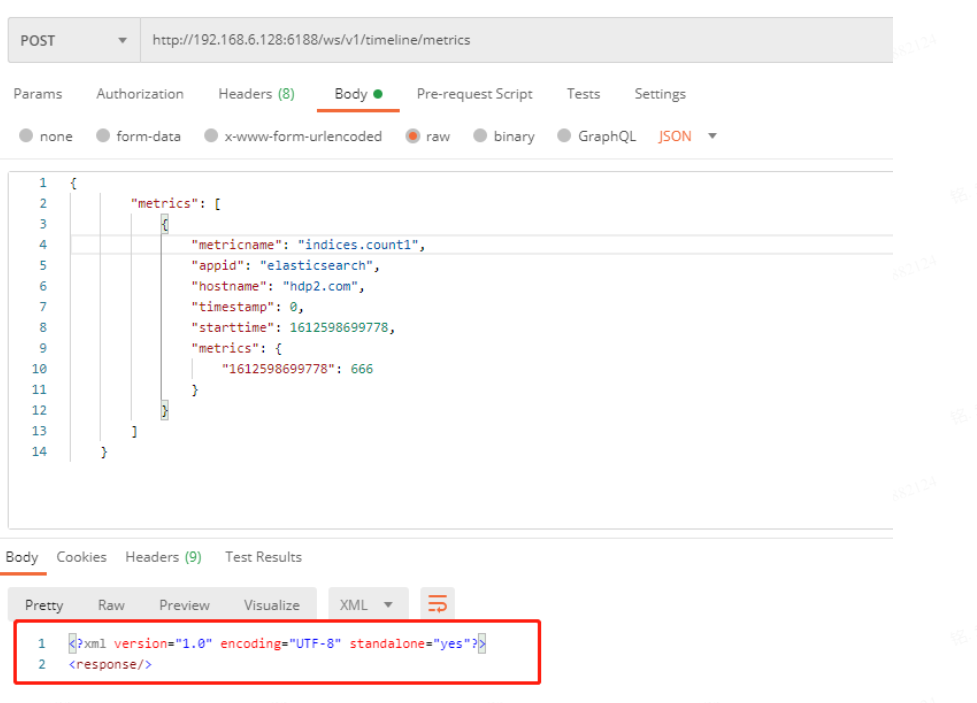
POSTMAN测试 首先我们通过postman向Collector发送一下测试的指标数据,测试一下前面的配置是否成功
1
2
3
4
5
6
7
8
9
10
11
12
13
14
{ "metrics" : [ { "metricname" : "indices.count2" , "appid" : "elasticsearch" , "hostname" : "hdp2.com" , "timestamp" : 1612608282778 , "starttime" : 1612608282778 , "metrics" : { "1612608282778" : 333 } } ] }
standalone:"yes"就说明已经将指标发送成功
正式编写监控指标脚本 1 2 3 4 5 6 7 8 9 10 11 12 13 14 15 16 17 18 19 20 21 22 23 24 25 26 27 28 29 30 31 32 33 34 35 36 37 38 39 40 41 42 43 44 45 46 47 48 49 50 51 52 53 54 55 56 57 58 59 60 61 62 63 64 65 66 67 68 69 70 71 72 73 74 75 76 77 78 79 80 81 82 83 84 85 86 87 88 89 90 91 92 93 94 95 96 97 98 99 100 101 102 103 104 105 106 107 108 109 110 111 112 113 114 115 116 117 118 119 120 121 122 123 124 125 126 127 128 129 130 131 132 133 134 135 136 137 138 139 140 141 142 143 144 145 146 147 148 149 150 151 152 153 154 155 156 157 158 159 160 161 162 163 164 165 166 167 168 169 170 171 172 173 174 175 176 177 178 179 180 181 182 183 184 185 186 187 188 189 190 import jsonimport loggingimport osimport sysimport timeimport socketimport requestsparams_data = sys.argv[1 ] params_json = json.loads(params_data) mc_ip = params_json['metrics_collector' ]['ip' ] mc_port = params_json['metrics_collector' ]['port' ] es_pid_file = params_json['es' ]['pid_file' ] es_ip = params_json['es' ]['ip' ] es_port = params_json['es' ]['port' ] es_log_dir = params_json['es' ]['log_dir' ] elastic_log_dir = "{0}" .format (es_log_dir) metrics_log_file = "es_metrics.log" metrics_log = os.path.join(elastic_log_dir, metrics_log_file) es_cluster_stats_api = "http://{0}:{1}/_cluster/stats" .format (es_ip, es_port) es_cluster_health_api = "http://{0}:{1}/_cluster/health" .format (es_ip, es_port) metrics_collector_api = "http://{0}:{1}/ws/v1/timeline/metrics" .format (mc_ip, mc_port) if not os.path.exists(elastic_log_dir): os.makedirs(elastic_log_dir, 0o644 ) ch = logging.StreamHandler() ch.setLevel(logging.INFO) logging.basicConfig(level=logging.INFO, filename=metrics_log, filemode='a' , format ='%(asctime)s - %(filename)s [line:%(lineno)d] %(levelname)s: %(message)s' , ) logger = logging.getLogger() logger.addHandler(ch) logger.info("data type: {0}, params_data: {1}" .format (type (params_data), params_data)) def read_file (pid_file, encoding=None ): with open (pid_file, "rb" ) as fp: content = fp.read() content = content.decode(encoding) if encoding else content return content def check_process (pid_file ): if not pid_file or not os.path.isfile(pid_file): logging.error("Pid file {0} is empty or does not exist" .format (str (pid_file))) return False else : pid = -1 try : pid = int (read_file(pid_file)) except RuntimeError: logging.error("Pid file {0} does not exist or does not contain a process id number" .format (pid_file)) try : os.kill(pid, 0 ) logging.info("process already exists! " ) process_is_exist = True except OSError: logging.error("Process with pid {0} is not running. Stale pid file" " at {1}" .format (pid, pid_file)) process_is_exist = False return process_is_exist def get_api_data (): try : logging.info("elasticsearch cluster stats api: {0}" .format (es_cluster_stats_api)) stats_resp = requests.get(es_cluster_stats_api) stats_content = json.loads(stats_resp.content) indices_count = stats_content['indices' ]['count' ] heap_used_memory = stats_content['nodes' ]['jvm' ]['mem' ]['heap_used_in_bytes' ] heap_max_memory = stats_content['nodes' ]['jvm' ]['mem' ]['heap_max_in_bytes' ] nodes_number = stats_content['_nodes' ]['successful' ] total_nodes_number = stats_content['_nodes' ]['total' ] nodes_mem_percent = stats_content['nodes' ]['os' ]['mem' ]['used_percent' ] send_metric_to_collector("indices.count" , indices_count) send_metric_to_collector("heap.used.memory" , heap_used_memory) send_metric_to_collector("heap.max.memory" , heap_max_memory) send_metric_to_collector("nodes.number" , nodes_number) send_metric_to_collector("nodes.total" , total_nodes_number) send_metric_to_collector("nodes.mem.percent" , nodes_mem_percent) logging.info("elasticsearch cluster health api: {0}" .format (es_cluster_health_api)) health_resp = requests.get(es_cluster_health_api) health_content = json.loads(health_resp.content) unassigned_shards = health_content['unassigned_shards' ] send_metric_to_collector("unassigned.shards" , unassigned_shards) except Exception as e: logging.error(e) def send_metric_to_collector (metric_name, metric_data ): appid = "elasticsearch" millon_time = int (time.time() * 1000 ) hostname = socket.gethostname() header = { "Content-Type" : "application/json" } metrics_json = { "metrics" : [ { "metricname" : metric_name, "appid" : appid, "hostname" : hostname, "timestamp" : millon_time, "starttime" : millon_time, "metrics" : { millon_time: metric_data } } ] } logging.info("[{0}] send metrics to collector data: {1}" .format (metric_name, metrics_json)) try : resp = requests.post(metrics_collector_api, json=metrics_json, headers=header) logging.info("send metrics result: {0}" .format (resp.content)) except Exception as e: logging.error("send metrics failure: {0}" .format (e)) pass def check_and_send (): while check_process(es_pid_file): get_api_data() time.sleep(10 ) if __name__ == "__main__" : check_and_send()
根据api接口查看指标详情 http://192.168.6.128:6188/ws/v1/timeline/metrics?metricNames=indices.count1&appId=elasticsearch
注意大小写,是 appId 。
FAQ
页面展示乱码
需要查看mysql数据库的编码,是不是 utf8。
如何查看日志
成功部署之前看ambari-server.log
成功部署之后看ambari-metrics-collector.log
注意widgets.json的两种写法
这里的具体区别,详细看一下es的ambari更改的源码
控制台爆出js报错
这里需要注意下面两个参数是不是写法正确
“layout_name”: “default_${服务名小写}_dashboard”
“section_name”: “${服务名大写}_SUMMARY”
调试步骤 更改完成后需要重启ambari-server和重装服务才能生效
这里需要注意的是:生效之后需要在Actions中点击Browse Widgets添加最新的Widget部件,添加新部件后才会生效,但是这里ambari有一个bug,就是旧的之前的监控指标信息会保存在 widget表中,如果要不显示之前的指标只能手动删除 widget表之前的数据,这里可能要更改一下源码再调试一下ambari,看看这里的逻辑应该在新增之前清理一下旧数据